Each week Lo ngleaftrading.com will be providing us a chart of the week as analyzed by a member of their team. We hope that you enjoy and learn from this new feature.
WEEKLY GOLD REPORT (9-24 through 9-28)
After a fairly choppy trade last week, the December Gold Futures were able to pull off a rally to chart resistance last night before finally feeling the pressure of a strong US Currency. While the US Dollar spent most of last week recovering from a three week drop, Gold prices remained relatively unchanged.
Last night Gold Futures climbed to $1775 an ounce before losing momentum and falling almost $20. All of this action had taken place before the open of the pit in New York on Monday morning. I mentioned in last weeks report that key upside resistance for Gold would likely target numbers in $25 increments. I truly expected much more out of Gold, following the FED’s announcement to move forward with QE3, and especially after finding out that Japan also went back to the printing press. My target last week was $1800 and possibly $1825. While I was disappointed in the choppy market, I am pleased to see that Gold continues with the trend of using targets with $25 resistance levels.
If traders are looking for a reason to explain last weeks channel, look no further than Europe. I suppose we all expected a short hangover following QE3 and thought there would be articles written about the news being “priced in”, but I do not think anyone expected reversals in the Dollar and the Euro to last all week. While European reports were less than favorable last week, the headline news continued to be whether or not Spain and Italy would finally request their next bailout. Each day that they stall, the Euro slides and the Dollar rallies. This is a hindrance on the bullish campaign of “Gold Bugs”. I believe that this news will continue to drive these two Currencies until the Euro hits a low target around 128.50 (200 day moving average), at which point a recovery will begin. Because of the inverse relationship, a bounce in the Euro will pressure the US Dollar, and this will help Gold recover to retest $1775 and target $1800 next. While fundamental news is always important, I believe this week will rely heavily on technical trading.
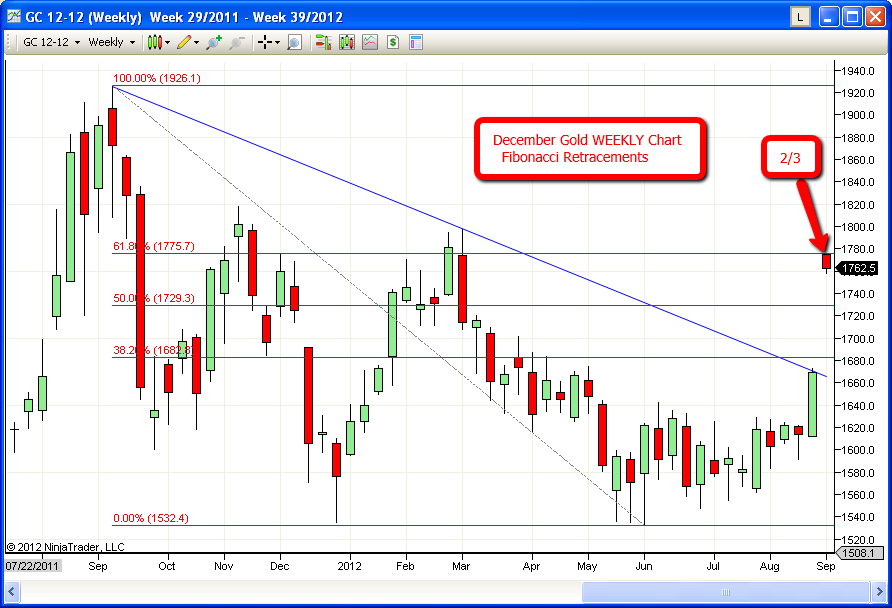
Normally, I include a DAILY chart of Gold for this article, but this week I charted the WEEKLY chart for the purpose of pointing out last night’s resistance level. The chart above includes Fibonacci Retracements that show $1775 being a 2/3rds retracement between the early June low and the September 2011 high. This was the target for the Sunday night rally.
I believe Gold will remain under pressure early this week until the Euro reverses off of the 200 day moving average. The support levels that I expect Gold to target are $1750 and if this level does not hold, look for $1730 to be next (Fibonacci 50% on the weekly chart provided). At either of these levels, I expect resting buy orders to hold up sellers in the market.
Good luck this week and please feel free to contact me directly to discuss trading the Gold or any Futures Market. Long Leaf Trading Group will continue to offer lowered commissions and a free demo of any of our available trading platforms to all new traders who inquire. This offer is available to all traders, both self-directed and broker-assisted. To inquire by phone, cal (888) 272-6926 or by email at bbooth@longleaftrading.com.
Thank you for your interest,
Brian Booth
Senior Market Strategist
bbooth@longleaftrading.com
888.272.6926
No comments:
Post a Comment