We’ve asked our friend Jim Robinson of profittrading.com to provide his expert analysis of charts to our readers. Each week he’ll be be analyzing a different chart using the Trade Triangles and his experience.
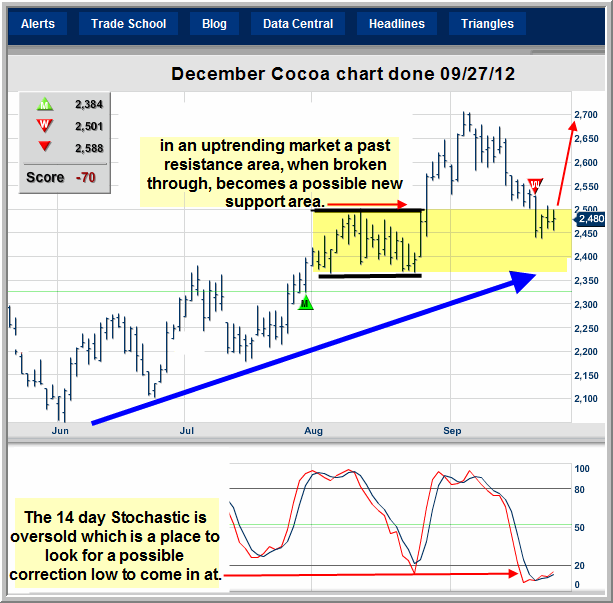
Today he is going to take a look at the technical picture of December Cocoa (CC.Z12.E). I hope you had a GREAT week !
This week let’s take a look at December Cocoa.
The monthly MarketClub Trade Triangle is green which means the longer term monthly time frame is bullish.
The weekly MarketClub Trade Triangle is red which means the weekly time frame is bearish.
Cocoa is probably in a counter trend correction of a longer term bull market.
If Cocoa trades higher from here and the weekly MarketClub Trade Triangle goes back to green that would be bullish as both the weekly and monthly time frames would be pointing to higher prices.
Cocoa is definitely a Chart to Watch and see how the MarketClub Trade Triangle’s play out from here,as Cocoa probably has some big moves coming up soon!

Thanks,
Jim Robinson
Profit Trading.com
No comments:
Post a Comment