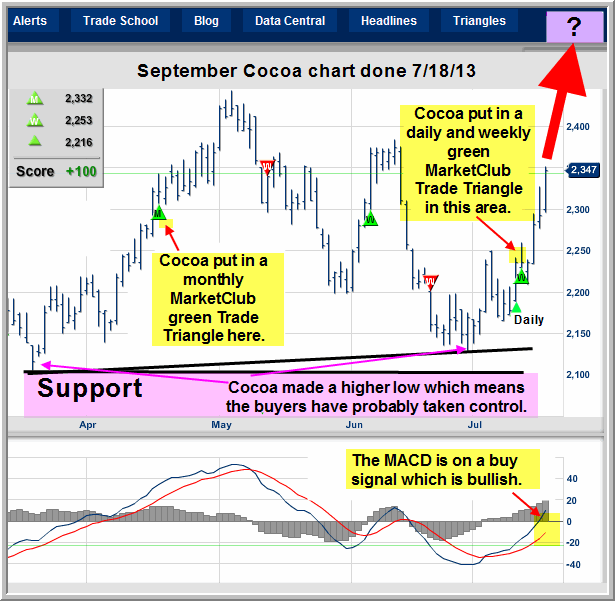
We've asked our friend Jim Robinson of profittrading.com to provide his expert analysis of charts to our readers. Each week he'll be be analyzing a different chart using the Trade Triangles and his experience.
Today he is going to take a look at the technical picture of Cocoa. (NYBOT_CC.U13.E ).
I hope you are having a GREAT week !!!
This week let's take a look at the Cocoa futures chart.
With futures we use the weekly to tell the trend and the daily for timing the trade.
Right now Cocoa is on a monthly, weekly, and daily MarketClub green Trade Triangle. Having the monthly on a MarketClub green Trade Triangle is not necessary to take the trade, and it is bullish having the monthly Trade Triangle pointing up.
Since Cocoa has made quite a strong move higher so far it is probably due for a minor pull back which could put in a daily MarketClub sell signal.
If Cocoa were to put in a red daily Trade Triangle and the weekly stays on a green weekly Trade Triangle that is the place to start looking to go long. Then if Cocoa traded higher and put in a new green daily Trade Triangle, that would be the place to go long Cocoa using the MarketClub Trade Triangles.
So Cocoa is a Chart to Watch as higher prices might be on the way.

Thanks,
Jim Robinson
Profit Trading.com
No comments:
Post a Comment