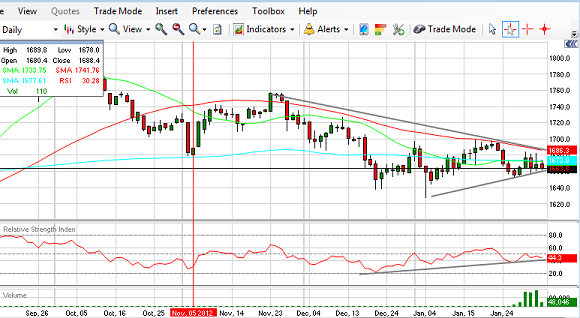
Each week longleaftrading.com will be providing us with a commodity chart of the week as analyzed by a member of their team. We hope that you enjoy and learn from this new feature.
Gold has been a frustrating market for a lot of traders for the last few months. If you are the buy and hold type or one who tries to find dynamic trends to capture, gold has not been an attractive market for you. Gold, however, is now getting interesting and could provide a move this week, especially if markets get negative and a flight to safety bid enters the market.
The market has been building a solid base since the January lows and technically we are now getting to a point where a move could occur if we can penetrate the upward portion of the wedge you can see in the chart above. The top of the wedge and the 50 day moving average both come in right at 1685/ounce and a close over that level would bode well for gold if it is breached.
There are many ways you can approach being long gold, depending on your appetite for risk and your general preference for trade strategy.

As always, feel free to contact me directly with any questions or comments regarding trading in the Futures Markets or if you have specific questions about the material in this report. I can be reached by email at tevans@longleaftrading.com or by phone at (866) 372-6926.
Thank you for your interest,
Timothy Evans
Chief Market Strategist
Phone: (866) 325-9873
www.longleaftrading.com
There is a substantial risk of loss in trading futures and options. Past performance is not indicative of future results. The information and data contained in this article was obtained from sources considered reliable. Their accuracy or completeness is not guaranteed.
No comments:
Post a Comment