We've asked our friend Jim Robinson of profittrading.com to provide his expert analysis of charts to our readers. Each week he'll be be analyzing a different chart using the Trade Triangles and his experience.
Today he is going to take a look at the technical picture of Valeant Pharmaceuticals International, Inc. (VRX ).
I hope you are having a GREAT week !
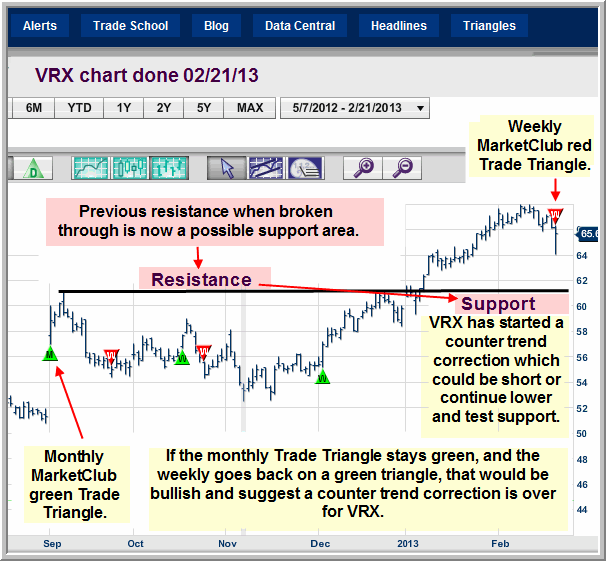
VRX is on a monthly green MarketClub Trade Triangle and has been an extremely strong stock which suggests there is a good chance this stock will continue higher in the long run.
No matter how strong a stock is there will always be counter trend corrections along the way to higher prices and VRX has started a counter trend correction as shown by the weekly red MarketClub Trade Triangle.
We never know how big the correction will be, or if it might even turn into more than a correction, and in hind site be a top in the stock, so the best thing to do on a weekly MarketClub red Trade Triangle is to get out and wait for the next opportunity to go long.
If as VRX corrects and the monthly Trade Triangle stays green, then the weekly goes back on a green Trade Triangle, that would be a place to consider going long VRX.
A good place to look for a correction low to come in, would be close to the break out of the last resistance area, as stocks will often come back and test break outs.

VRX is a top stock with great upside potential, which makes it a Chart to Watch.
Thanks,
Jim Robinson
Profit Trading.com
No comments:
Post a Comment