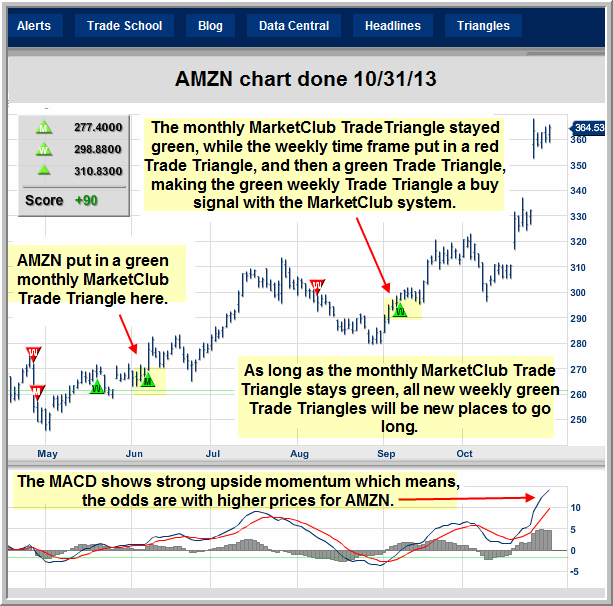
We've asked our friend Jim Robinson of profittrading.com to provide his expert analysis of charts to our readers. Each week he'll be analyzing a different chart using the Trade Triangles and his experience.
Today he is going to take a look at the technical picture of the Amazon (NASDAQ:AMZN ).
I hope you are having a GREAT week !
With the MarketClub system for stocks, you use the monthly Trade Triangle to tell the trend, and the weekly Trade Triangle to time the entry points and stops.
MarketClub put in a green monthly Trade Triangle for Amazon (NASDAQ:AMZN) on 06/07/13, which tells us the major trend is up.
MarketClub then put in a weekly red Trade Triangle for Amazon (NASDAQ:AMZN) on 08/08/13, which ended up being a counter trend correction, because the monthly Trade Triangle stayed green.
MarketClub went back on a green weekly Trade Triangle on 09/09/13, which was a buy signal with the Market Club system.
Amazon (NASDAQ:AMZN ) has made a strong move up since, which means the odds are with higher prices from here.
As long as the monthly Trade Triangle stays green, I would consider all weekly red Trade Triangles counter trend corrections with the MarketClub system, and then all new weekly green Trade Triangle's would be buy signals to go long.
Amazon (NASDAQ:AMZN) is a big stock, that looks to have big things in store, making it an excellent Chart to Watch right now !
Thanks,
Jim Robinson
Profit Trading.com

No comments:
Post a Comment