Today, I am going to take an in-depth look into the world of crude oil. The question on most traders' minds is, has this market finally bottomed out?
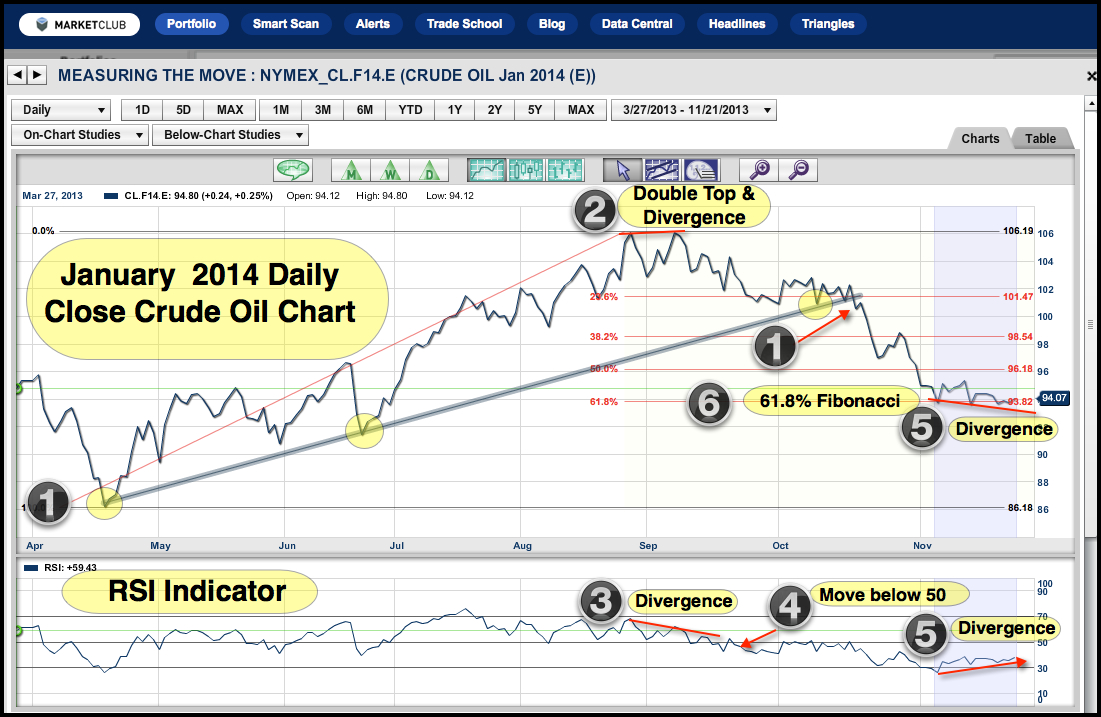
As you can see on the chart, crude oil prices have been had been steadily moving higher for the most part of this year, until they peaked in September. We see (1) a strong supporting trend line which hit three places on the chart, making it a valid trend line of some importance. This trend line was dramatically broken in October and since then, the price of crude oil has fallen from over $100 a barrel to around the $94 a barrel level. Two events indicated this could happen, the (2) double top and divergence on the chart and (3) the divergence on the RSI indicator.
1) Trend line and trend line break
2) Double top and divergence
3) RSI divergence
4) Move below 50 line
5) Bullish divergence
6) Fibonacci retracement
The move accelerated (4) when the RSI moved below the 50 line, which then became a resistance zone to any further rallies in crude oil. It wasn't until we reached (5) that the crude oil market potentially created a bullish divergence. The importance of this divergence (6) cannot be overlooked as it came from a 61.8% Fibonacci retracement support zone, which was measured from the lows in April to the highs seen in September.
As we move forward, I think many traders will be watching this market closely for a rebound back to the $100 level. Presently all of our Trade Triangles (not illustrated on this chart) are negative, indicating that the trend remains to the downside at this time.
What do you think of this chart and this market? Please feel free to share your views below.
Every success,
Adam Hewison
President, INO.com
Co-Creator, MarketClub
No comments:
Post a Comment