Today, I'm going to analyze the gold market and in particular the spot gold market, which really drives everything in gold trading.
In 2013, gold turned out to be a real loser for the gold bulls, dropping some 20+ percent on the year and the year is not over with. While equities soared, the gold markets swooned and didn't receive any love from anyone. In fact, many of the big players like Soros, John Paulson and other large hedge fund managers began dumping their GLD ETF holdings just recently, as they too have had enough of the yellow metal's antics. All of this weighed heavily on the price of gold.
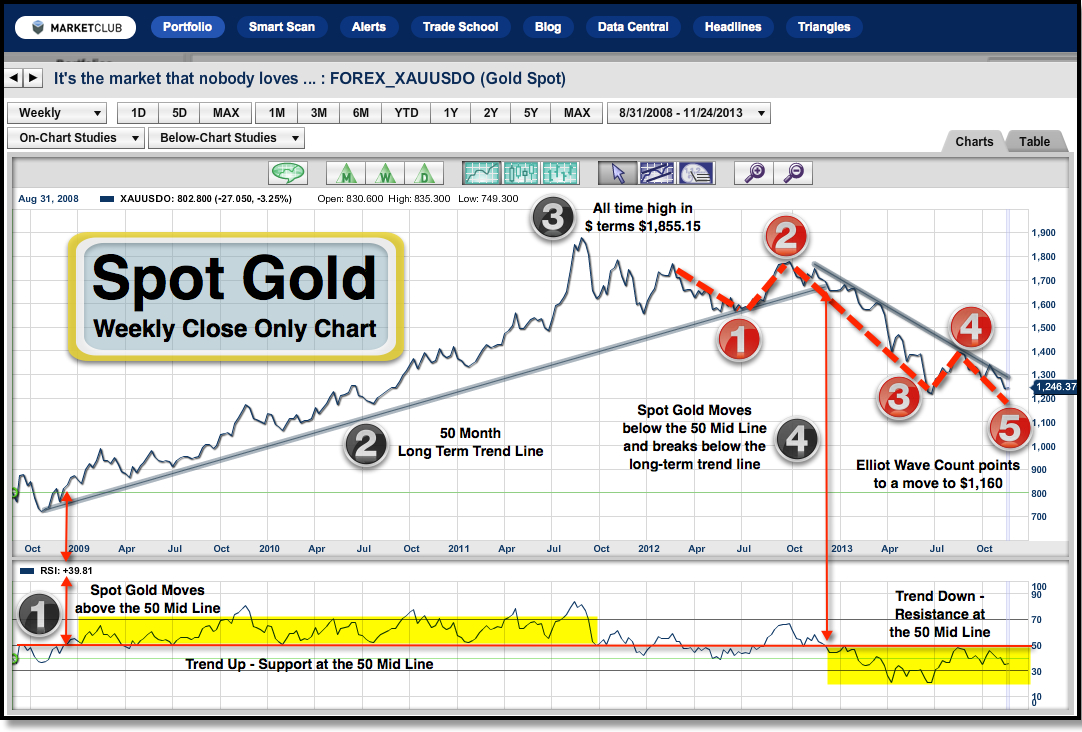
Looking on the chart at (1), the RSI indicator moved above the mid-line at 50 back in December of 2008, indicating a change in trend to the upside. A month earlier, the green weekly Trade Triangle had kicked in, indicating that the trend was indeed turning up. Once over the RSI mid-line at 50, gold prices steadily increased for the next several years, and hit an all-time high of $1855.15 on September 4th of 2011. For those of you who were following gold at that time, practically everyone was calling for a move to the $2000 level. In retrospect, too many investors were long gold and of course the fabled $2,000 was never seen.
At (4) on the chart, the RSI indicator moved below the 50 mid-line, pushing the gold market into a bear trend. At the same time, the 50-month long term trend line was broken to the downside. On December 18th of 2012, MarketClub’s red monthly Trade Triangle kicked in, indicating that the longer term trend for gold was negative.
——————
BLACK NUMBERS
1.Spot Gold moves above the 50 mid-line
2.50-month long term trend line
3.All-time high of $1,855.15
4.Spot Gold moves below the 50 mid-line and breaks below the long term trend line
RED NUMBERS
5. Elliot Wave count points to a move to $1,160
——————
On the chart you will also see a series of red numbers. These numbers signify a potential Elliott Wave count to the downside. I believe we've already seen the third wave, from $1800 down to $1200. The countertrend wave from (3) to (4), which was approximately a $200 move, indicates that the current move should be wave 5 and push gold prices below the $1200 level on a weekly closing basis.
To summarize, I expect the current trend in gold to continue right now. Our long-term monthly Trade Triangle, which has been negative on gold since $1672.40, remains intact at this time. I believe that gold is not out of the woods yet and has a great deal of work to do before it can resurrect itself in the eyes of most investors and gold bulls.
If I am correct in my analysis, we could potentially see gold move down to $1160 an ounce based on a Fibonacci count. There is also a strong possibility that gold will find an equilibrium some time in the first half of 2014.
As always, we welcome your comments and feedback on this analysis. Tell us what you think of gold and leave a comment.
Every Success,
Adam Hewison
President, INO.com
Co-Creator, MarketClub
No comments:
Post a Comment