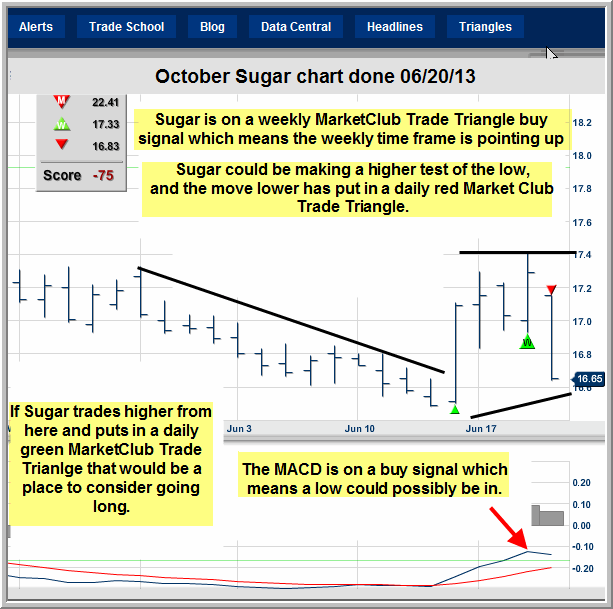
We've asked our friend Jim Robinson of profittrading.com to provide his expert analysis of charts to our readers. Each week he'll be be analyzing a different chart using the Trade Triangles and his experience.
Today he is going to take a look at the technical picture of the October Sugar (SB.V13.E ).
I hope you are having a GREAT week !!!
This week let's take a look at October Sugar.
For futures we use the weekly MarketClub Trade Triangle for trend and the daily MarketClub Trade Triangle for timing.
Sugar has put in a weekly green MarketClub trade Triangle which means the weekly time frame is pointing up as of right now.
Sugar is on a daily red MarketClub Trade Triangle which reflects the sharp move down, which could end up being a higher test of the low.
If Sugar trades higher from here and puts in a green daily MarketClub Triangle, that would help to confirm that a low could be in and higher prices could be on the way.
If Sugar continues to trade lower and puts in a new price low, then the bullish trade setup wouldn't be in effect any more as the weekly MarketClub Trade Triangle would turn red.
So right now Sugar is a good Chart to Watch as a low could be in and higher prices could be on the way.

Thanks,
Jim Robinson
Profit Trading.com
No comments:
Post a Comment