We've asked our friend Jim Robinson of profittrading.com to provide his expert analysis of charts to our readers. Each week he'll be be analyzing a different chart using the Trade Triangles and his experience.
Today he is going to take a look at the technical picture of Natural Gas (NG.H13.E).
This week let's take a look at Natural Gas.
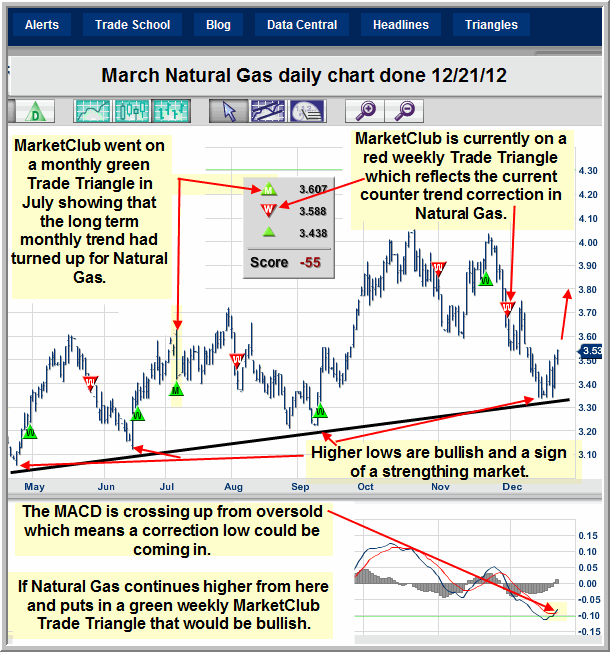
The Natural Gas chart put in a monthly green MarketClub Trade Triangle in July and the monthly Triangle has stayed green since.
The red and green weekly MarketClub Trade Triangles since July show the bull swings and counter trend corrections in the larger up trend.
Natural Gas may have put in a correction low for the current counter trend correction.
If Natural Gas trades higher from here and puts in a green weekly Trade Triangle that would confirm that a correction low is probably in.
So with the possibility that all three Trade Triangles could be pointing in the same direction soon, Natural Gas is definitely a Chart to Watch.

Thanks,
Jim Robinson
Profit Trading.com
No comments:
Post a Comment