Each week Lo ngleaftrading.com will be providing us a chart of the week as analyzed by a member of their team. We hope that you enjoy and learn from this new feature.
Weekly Gold Report (December 24 through December 28th)
What a week in the Precious Metals! While the drop in Gold and Silver caught me off guard, I suppose I was not totally surprised. Every year around this time, global markets get thin and it leaves price action vulnerable to unexpected, directional movement.
There were a few factors outside of light volume that may have played a role in the drop. First of all, Washington continues to overpromise and underperform on their Fiscal Cliff negotiations. One of the main points that will remain in limbo without a compromise is taxes. I believe that a large part of the selloff in the Metals was due to traders and investors continuing to book gains on long positions ahead of a potential tax hike next year. Furthermore, these drops invite new sellers to the market that are hoping for a larger scale setback. Second, it was rumored that a large position in the Metals was adjusted after Morgan Stanley decided to drop Paulson and his Metals based investment strategies.
Fundamentally, it is difficult this time of year to fully explain movement in the markets because of the light volume, but technically the market showed us a few things.
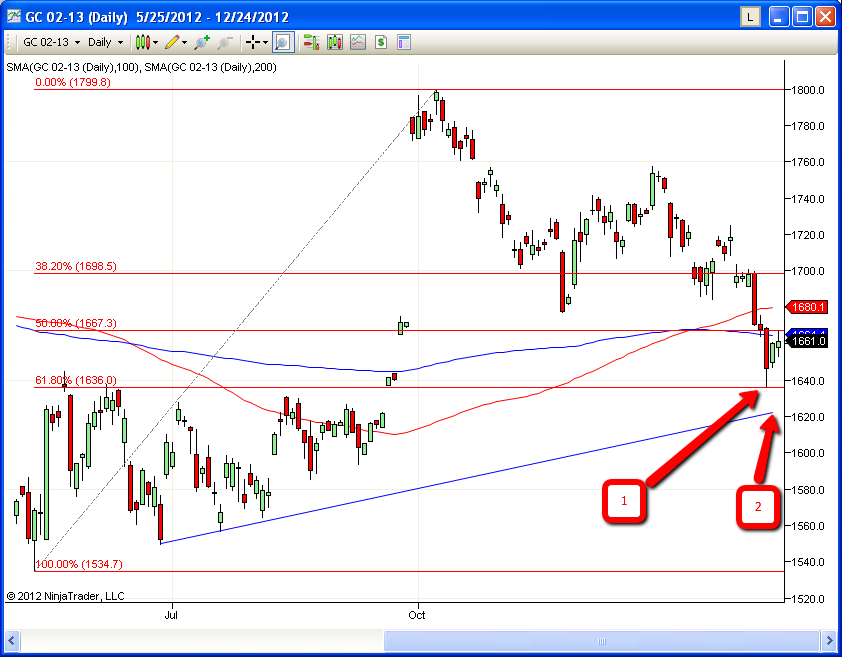
Based on the daily chart, the February Gold put in a low after retracing 2/3rds of the move that began in June and topped in October. Last week’s low shows the price target (arrow #1) after breaking below the convergence of the 200day simple moving average (blue wavy line) and the Fibonacci 50% Retracement. So far today, the Gold Futures have risen back to this area and used what was support as a resistance on the climb up.
Short term, last week’s low was a decent sign for traders that are long Gold, but it is still too early to tell whether the low has officially been put in. If the market were to fall below last week’s low, the next major support on the daily and the weekly chart is closer to $1625 an ounce (arrow #2).
If the market can show a few closes above the 200day simple moving average, I would think traders would feel more confident in their long positions.
Happy Holidays to everyone! As always, feel free to call or email me directly with any questions or comments about the Gold Market or any other Futures Markets that you are interested in. I will be happy to discuss them with you. I can be reached by phone at (888) 272-6926 or by email at bbooth@longleaftrading.com.
Thank you for your interest,
Brian Booth
Senior Market Strategist
bbooth@longleaftrading.com
888.272.6926
No comments:
Post a Comment