We've asked our friend Jim Robinson of profittrading.com to provide his expert analysis of charts to our readers. Each week he'll be analyzing a different chart using the Trade Triangles and his experience.
Today he is going to take a look at the technical picture of FireEye Inc. (NASDAQ:FEYE ).
With stocks you use the monthly MarketClub Trade Triangle to tell the trend and the weekly MarketClub Trade Triangles for the entry and exit points.
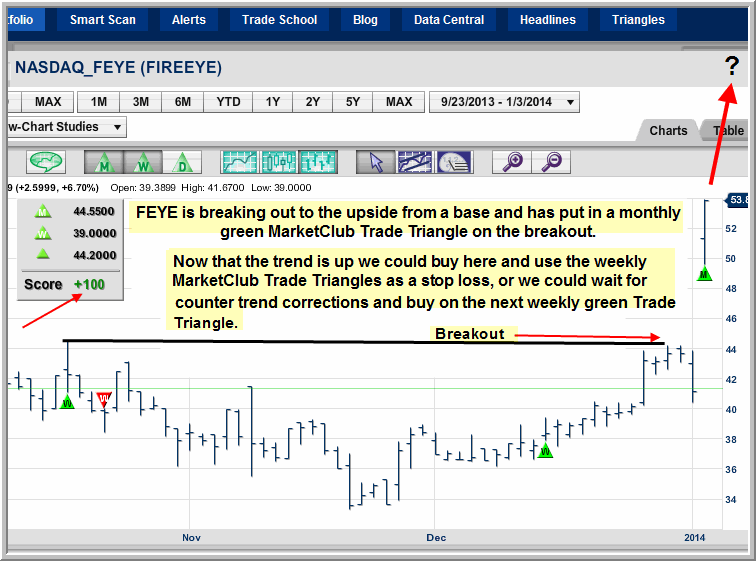
FireEye Inc.(NASDAQ:FEYE) just broke out Friday, so the analysis if good if the breakout holds, which it looks like it will do.
FEYE is put in a new monthly green Trade Triangle on Friday's (1/3/14) breakout.
The way to play FEYE from here is to buy today after Friday's breakout and use the weekly MarketClub Trade Triangles as a stop.
Or if buying on the breakout is something you would rather not do, then wait for counter trend corrections and then buy on the next green weekly Trade Triangle, as long as the monthly Trade Triangle stays green.
So NASDAQ:FEYE is a great Chart to Watch right now as it looks to have a lot of upside potential from here.
Thanks,
Jim Robinson
Profit Trading.com

No comments:
Post a Comment