We've asked our friend Jim Robinson of profittrading.com to provide his expert analysis of charts to our readers. Each week he'll be analyzing a different chart using the Trade Triangles and his experience.
Today he is going to take a look at the technical picture of the December Natural Gas Futures (NYMEX:TT.Z13.E ).
I hope you are having a GREAT week !
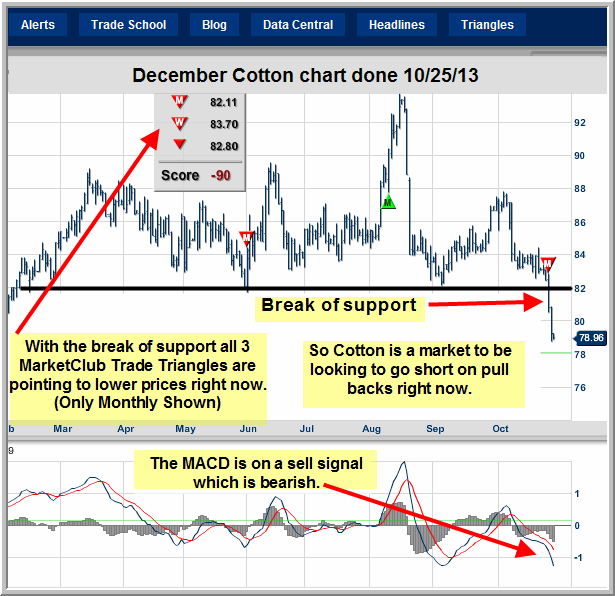
Cotton has made a breakout of support and there is a good chance Cotton will continue lower from here.
All three MarketClub Trade Triangles are pointing to lower prices right now, so we would want to sell Cotton on pull backs with the MarketClub system.
If Cotton trades higher putting in a green daily Trade Triangle, that is an opportunity to go short on the next daily red Trade Triangle, as long as the weekly Trade Triangle stays red.
With the MarketClub system we are always trading with the trend, and right now the trend in Cotton is down making this a Chart to Watch for selling opportunities.

Thanks,
Jim Robinson
Profit Trading.com
No comments:
Post a Comment