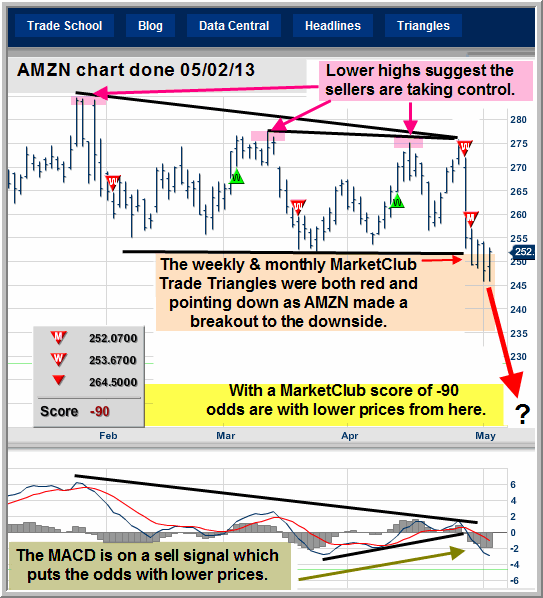
We've asked our friend Jim Robinson of profittrading.com to provide his expert analysis of charts to our readers. Each week he'll be be analyzing a different chart using the Trade Triangles and his experience.
Today he is going to take a look at the technical picture of Amazon.com Inc. (AMZN ).
I hope you are having a GREAT week !!!
This week AMZN looks like a great chart to take a look at.
MarketClub put in a weekly and monthly red Trade Triangle, as AMZN was breaking out to the down side of a sideways channel.
With a MarketClub score of -90, odds are with lower prices for AMZN.
The MACD momentum indicator is pointing down, which adds to the bearish evidence.
Individual stocks follow the general market, and the general market looks like it could be close to a top.
Right now I would recommend only selling stocks, (just my opinion) and AMZN looks like a great one to consider selling.
AMZN is definitely a Chart to Watch because when the high flying stocks (big stocks) start to break it is saying something important about the strength of the general market.

Thanks,
Jim Robinson
Profit Trading.com
No comments:
Post a Comment