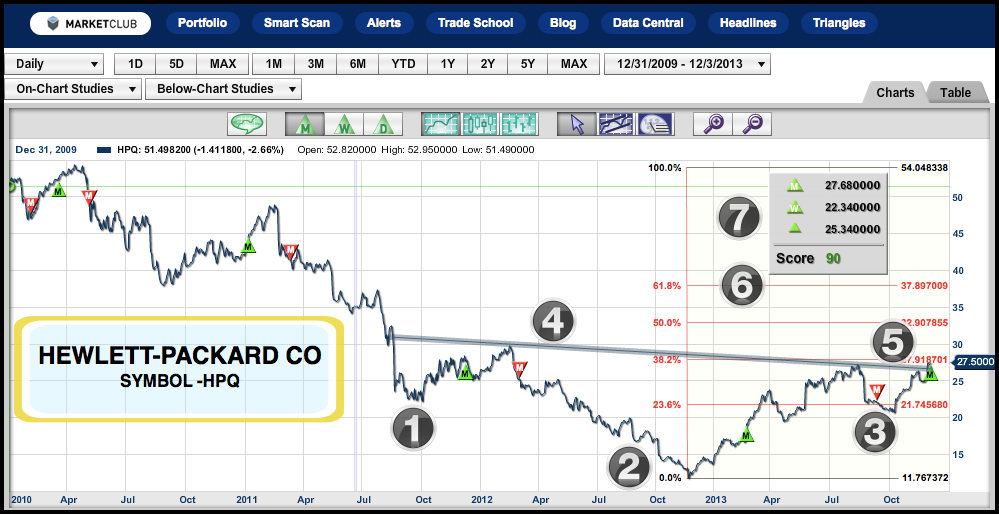
Once the Apple of its day, Hewlett-Packard (NYSE:HPQ) made some unfortunate decisions that then tanked the stock. After reaching a high of $54.75 on April 16, 2010, the stock of Hewlett-Packard hit a low of $11.35 some 32 months later.
Since that time, the stock has made a recovery into the mid to high 20s, but still has further to go on the upside based on pure technical analysis.
Yesterday, I looked at the stock of Groupon (NASDAQ:GRPN) and illustrated its head and shoulders chart pattern, one of the most reliable technical patterns in my playbook. Hewlett-Packard is just the opposite, as there is a very well supported head and shoulders base that is capable, in my opinion, of taking Hewlett-Packard back up to the $37 or $38 level.
Looking at the Trade Triangles, the monthly Trade Triangle kicked in yesterday at $27.68 for Hewlett-Packard, indicating that all systems were now a "go" on the upside for this stock.
1.) Left shoulder of a head and shoulders bottom
2.) Head of a head and shoulders bottom
3.) Right shoulder of a head and shoulders bottom
4.) Head and shoulders neckline
5.) Breakout and monthly Trade Triangle buy at $27.67 on 12/3/13
6.) Fibonacci target zone $37.89
7.) All Trade Triangles are green
As with any investment or trade, always use money management stops to protect capital.
We would like to know what you think, so feel free to add your comment below.
Every success with your trading,
Adam Hewison
President, INO.com
Co-Creator, MarketClub

No comments:
Post a Comment