We've asked our friend Jim Robinson of profittrading.com to provide his expert analysis of charts to our readers. Each week he'll be be analyzing a different chart using the Trade Triangles and his experience.
Today he is going to take a look at the technical picture of Coffee Holding Co. Inc. (JVA ).
I hope you are having a Happy New Year !
This week let's take a look at the JVA stock chart.
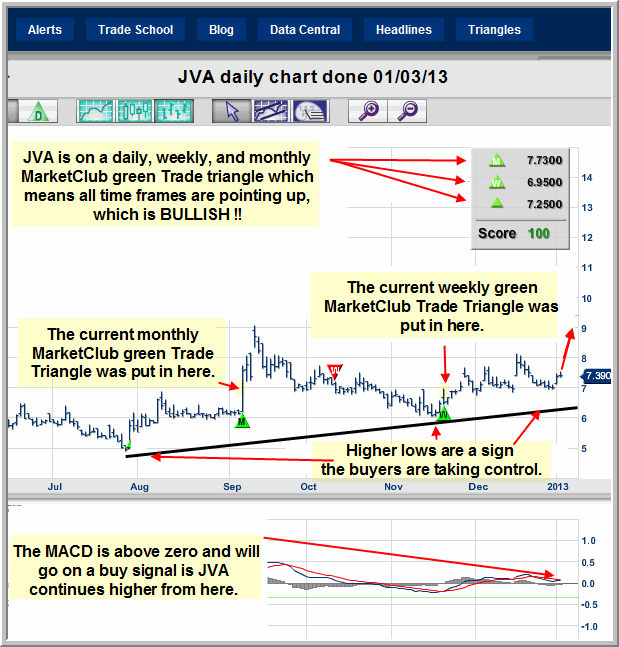
JVA is currently on a daily, weekly and monthly green MarketClub Trade Triangle and when all time frames are pointing in the same direction that is important information to have.
JVA is currently working on a base, making higher highs and higher lows and everything looks bullish as far as the chart pattern is concerned.
The MACD is turning bullish, so the technical picture is shaping up.
So with the combination of the bullish MarketClub Trade Triangles, bullish chart pattern and bullish technical picture, JVA is definitely a Chart to Watch.

Thanks,
Jim Robinson
Profit Trading.com
No comments:
Post a Comment